OpenFOAM in Practice: Exploring the F1 2026 Aero Window Across 37 Cases
Constrained by computing resources, I performed half-car OpenFOAM CFD simulations on a third-party F1 2026 CAD model across 37 usable cases. Through this study, I explored numerical discretization schemes and trade-offs involving front and rear wings, tire contact patches, ride height, yaw, rake, and lap times.
Background
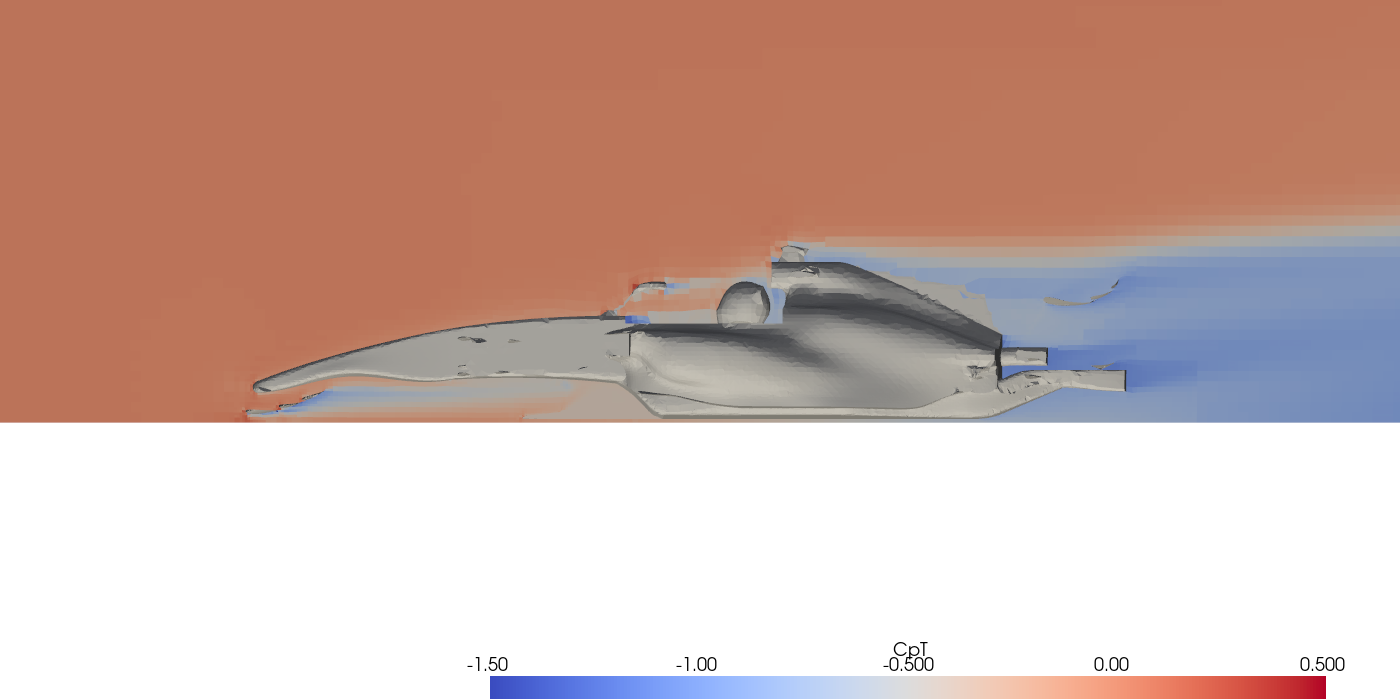
The project started when I obtained a third-party CAD model of the F1 2026 RB22 concept online and attempted to conduct a CFD study using OpenFOAM. This was my first time combining OpenFOAM with an F1 2026 concept car. Because the geometry was reconstructed from third-party CAD rather than official team data, the absolute numbers do not serve as direct real-car benchmarks; rather, this serves as a technical learning log.
My primary goal was to investigate how changing numerical discretization schemes, front and rear wing angles, tire contact patches, ride height, rake angle, and yaw angle affects aerodynamic drag, downforce, and front-to-rear aero balance. In total, I successfully ran 37 usable cases. An additional four early yaw cases failed due to incorrect tire boundary condition setups.
The primary baseline mesh contains approximately 4.35 million cells. Most steady-state cases used a first-order upwind scheme and high- wall functions. Furthermore, without wind tunnel or track correlation data, these findings cannot validate real-world vehicle performance.
Model and Computational Workflow
The original CAD geometry consists of 14 sub-STEP assemblies, with a full vehicle length of 5.40 m, width of 1.88 m, and wheelbase of 3.40 m. Simulations were run with a 50 m/s freestream velocity alongside a moving ground plane. The workflow:
STEP Geometry
→ Stitching & Triangulation
→ snappyHexMesh
→ Moving Ground & Rotating Wheels
→ OpenFOAM 14 Steady RANS or URANS
→ Mesh, Conservation, Log & Force Window Checks
→ Full-Car & Component Results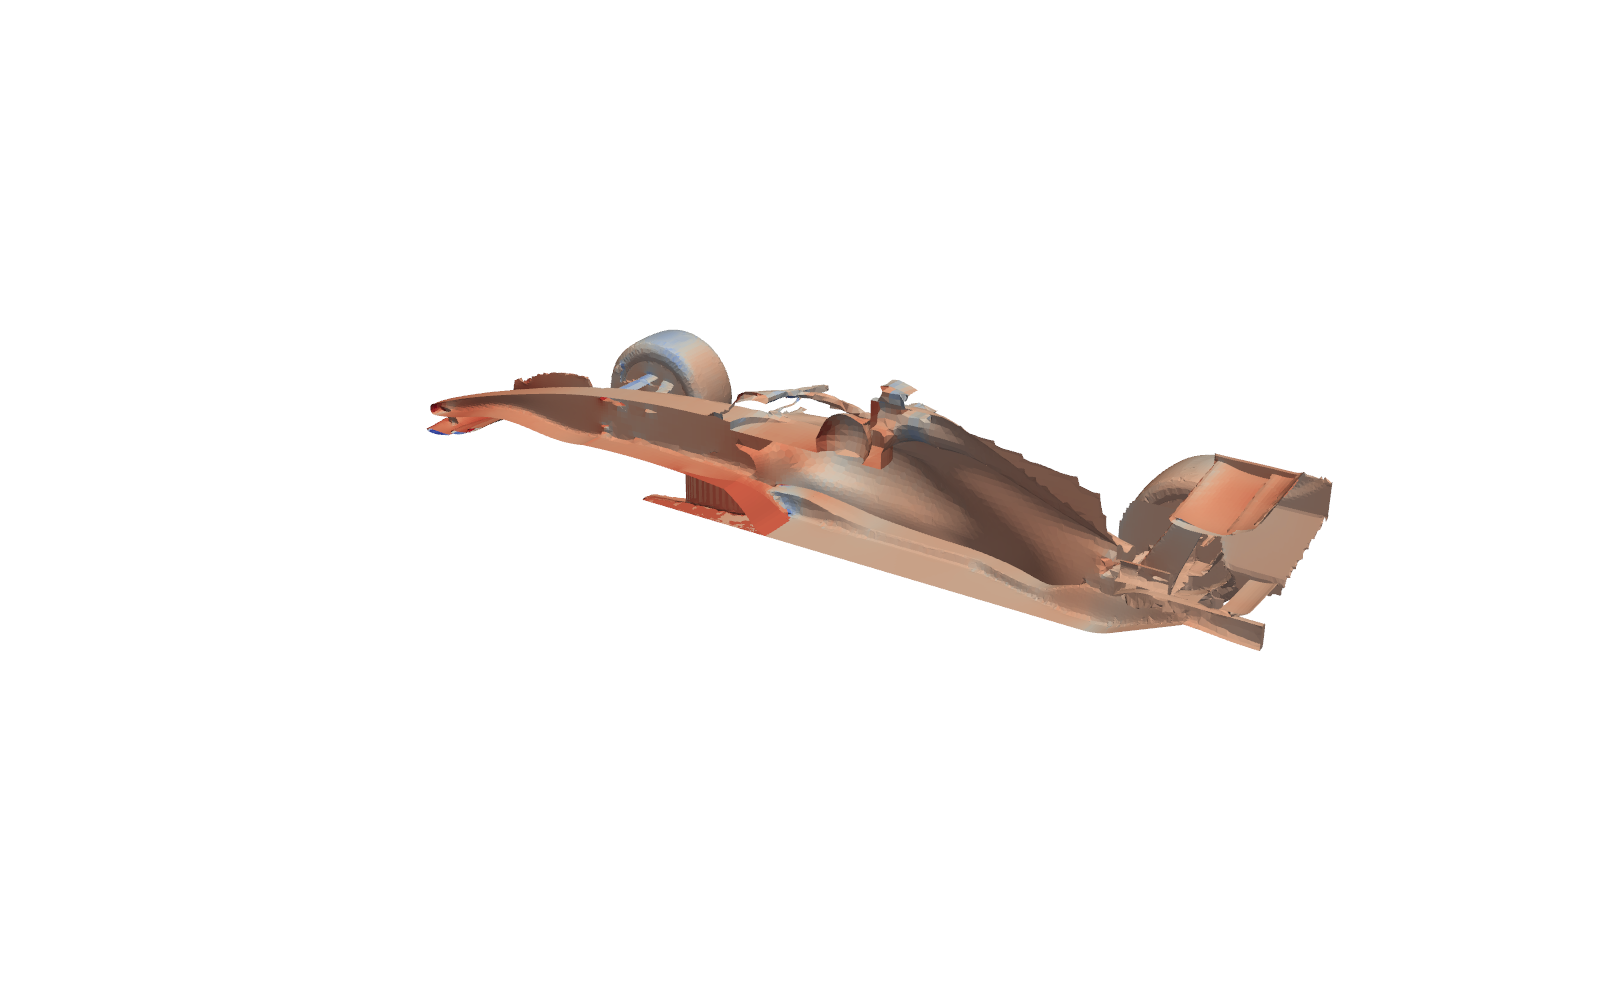
Investigating Numerical Uncertainty
I evaluated three mesh resolutions:
| Mesh | Cell Count | ||
|---|---|---|---|
| Coarse | 592,322 | 0.319 | −0.134 |
| Medium | 2,032,685 | 0.260 | −0.252 |
| Fine | 4,351,624 | 0.241 | −0.250 |
Drag varied monotonically as the mesh was refined, but downforce on the medium mesh slightly exceeded that of the fine mesh. Because a fourth-level mesh exceeded my workstation’s 15 GB RAM limit, the current data cannot formally prove grid independence.
The tail of the force history curve appears smooth, with short-window confidence intervals between 0.3% and 0.6%. However, expanding the averaging window from the last 50 iterations to 400 iterations shifts the mean by 15%–19%. Block resampling indicates downforce uncertainty on the order of 3%–5%. Consequently, I only interpret trends as meaningful when physical variations significantly exceed this margin.
Impact of Numerical Schemes
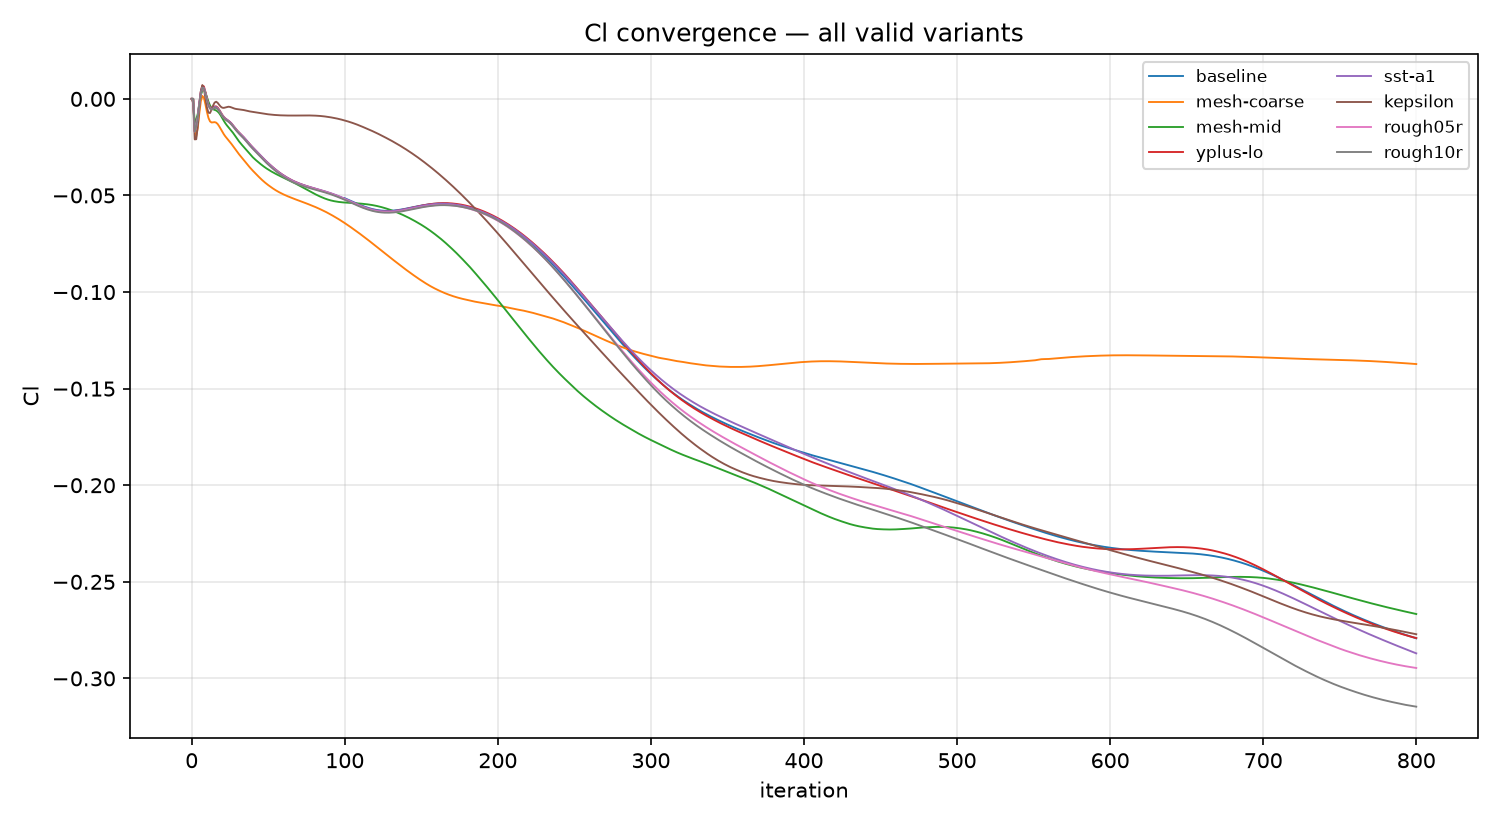
When I initially ran the second-order Linear Upwind scheme, the simulation immediately threw a floating-point exception (FPE), leading me to believe the mesh was unsuitable for second-order discretization. After switching to more robust solver settings, the exact same 4.35-million-cell mesh completed 800 iterations without issue:
| Scheme | ||
|---|---|---|
First-Order upwind | 0.241 | −0.250 |
linearUpwind | 0.237 | −0.236 |
The second-order scheme produced 1.8% lower drag and 5.6% lower downforce. This confirms that the initial failure stemmed from solver settings rather than an inherent limitation of second-order schemes on this mesh. While first-order results remain viable for relative comparisons across identical configurations, all findings must account for a ~6% numerical scheme delta.
Rear Wing Sensitivity
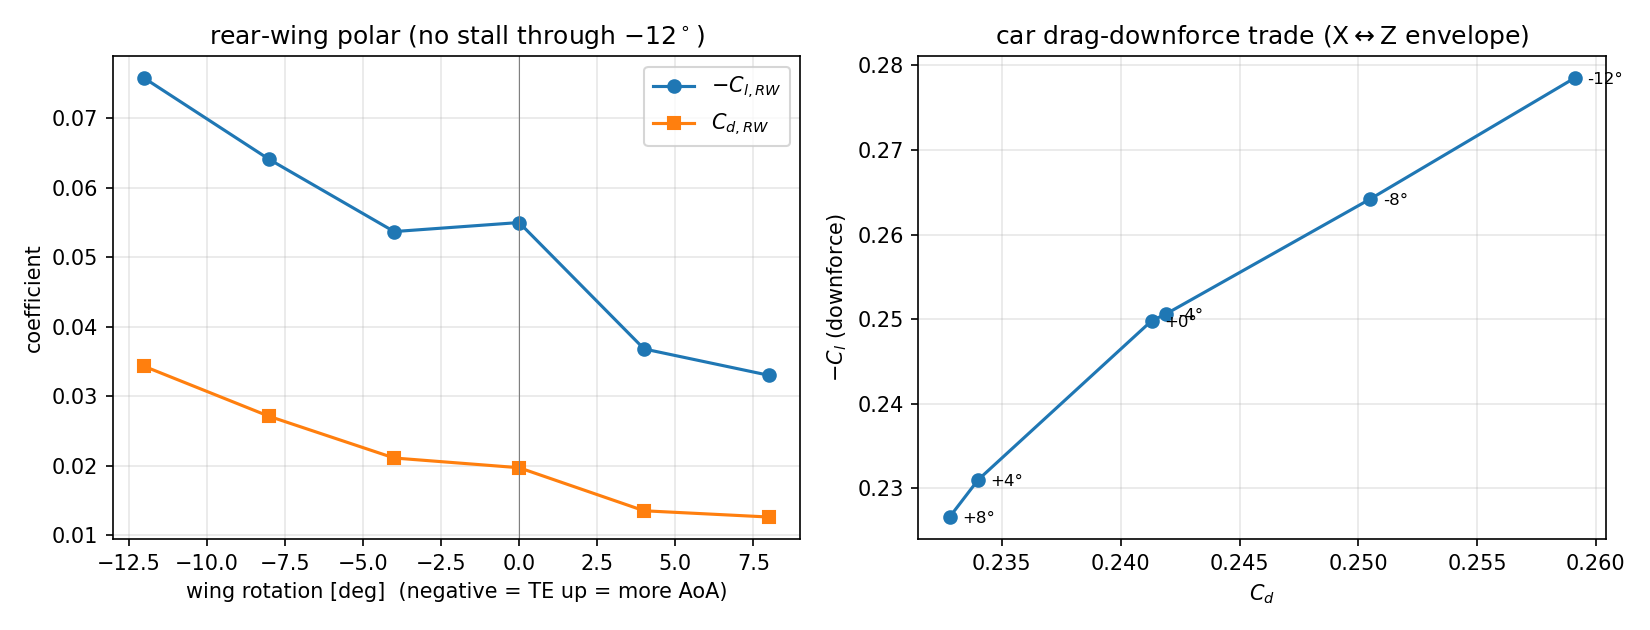
I swept the rear wing flap angle from down to to investigate whether drag reduction and downforce generation could be decoupled.
The key findings:
- At , rear wing downforce increased by 38% over baseline, accompanied by a 74% increase in rear wing drag, with no onset of stall.
- In the low-drag direction, pitching beyond yielded diminishing drag reduction per degree. Upwash from the underfloor diffuser means the effective flow angle seen by the rear wing does not decrease linearly with geometric rotation, placing an upper ceiling on drag savings in ‘Straight Mode’.
Across the entire sweep, total drag varied by up to 11%, and downforce by up to 23%.
The takeaway is that low drag and high downforce are not independent switches; rear wing adjustments inherently couple drag, downforce, and aerodynamic balance.
Front Wing Sensitivity
| Setting | Front Axle Distribution | ||
|---|---|---|---|
| Front Wing Unload | 0.2408 | −0.2079 | 8.6% |
| Baseline | 0.2413 | −0.2498 | 24.9% |
| Front Wing Angle Increase | 0.2437 | −0.2328 | 22.2% |
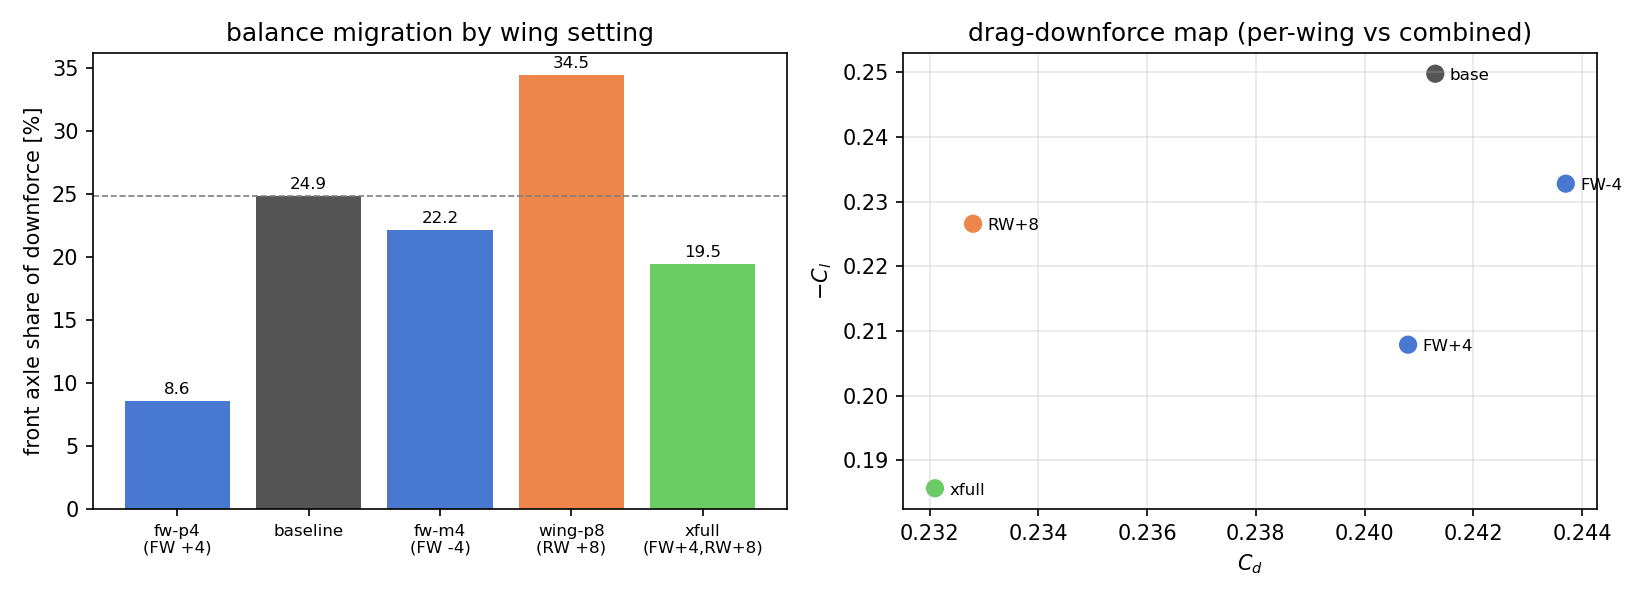
The front wing acts like a trim knob that can only be turned effectively in one direction. Unloading by dropped the front balance from 24.9% to 8.6%—a sharp 16.3 percentage point shift.
Conversely, increasing angle of attack failed to generate more load: with the leading edge dropping to just 34 mm from the ground, the front wing itself lost ~10% downforce while drag jumped by ~30%. At this ride height, the geometry hits ground-effect saturation and boundary layer breakdown.
I also calculated that unloading the front wing by approximately compensates for the rearward balance shift induced by an rear wing configuration. In this combined setup, front axle load distribution recovered to 23.9% (within 1 percentage point of baseline), at the cost of a 22.7% drop in total downforce.
Tire Contact Patch Modeling
In the raw CAD model, the tires made knife-edge line contact with the ground. In reality, vertical load deforms the tire, creating a flattened contact patch. By adding a 15 mm plinth beneath the tire contact zone, stagnation pressure ahead of the front tires and outward squish flow were noticeably mitigated.
This single geometric correction reduced total drag by 6.1% and increased downforce by 4.4%, improving aerodynamic efficiency () from 1.035 to 1.152 (+11%)—the largest single-variable gain observed.
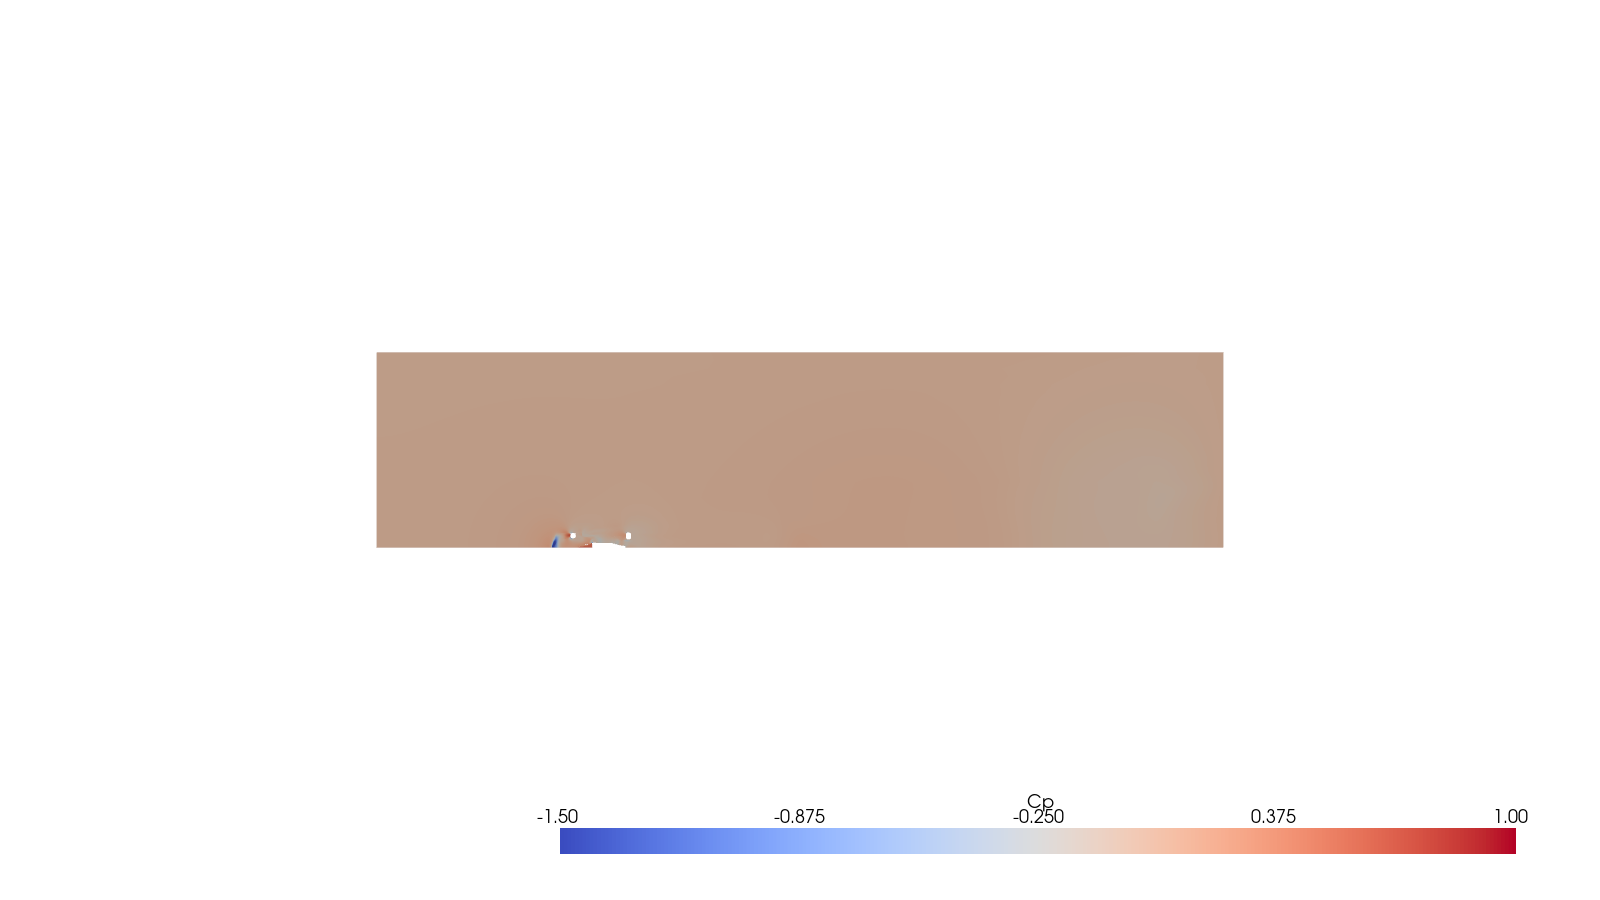
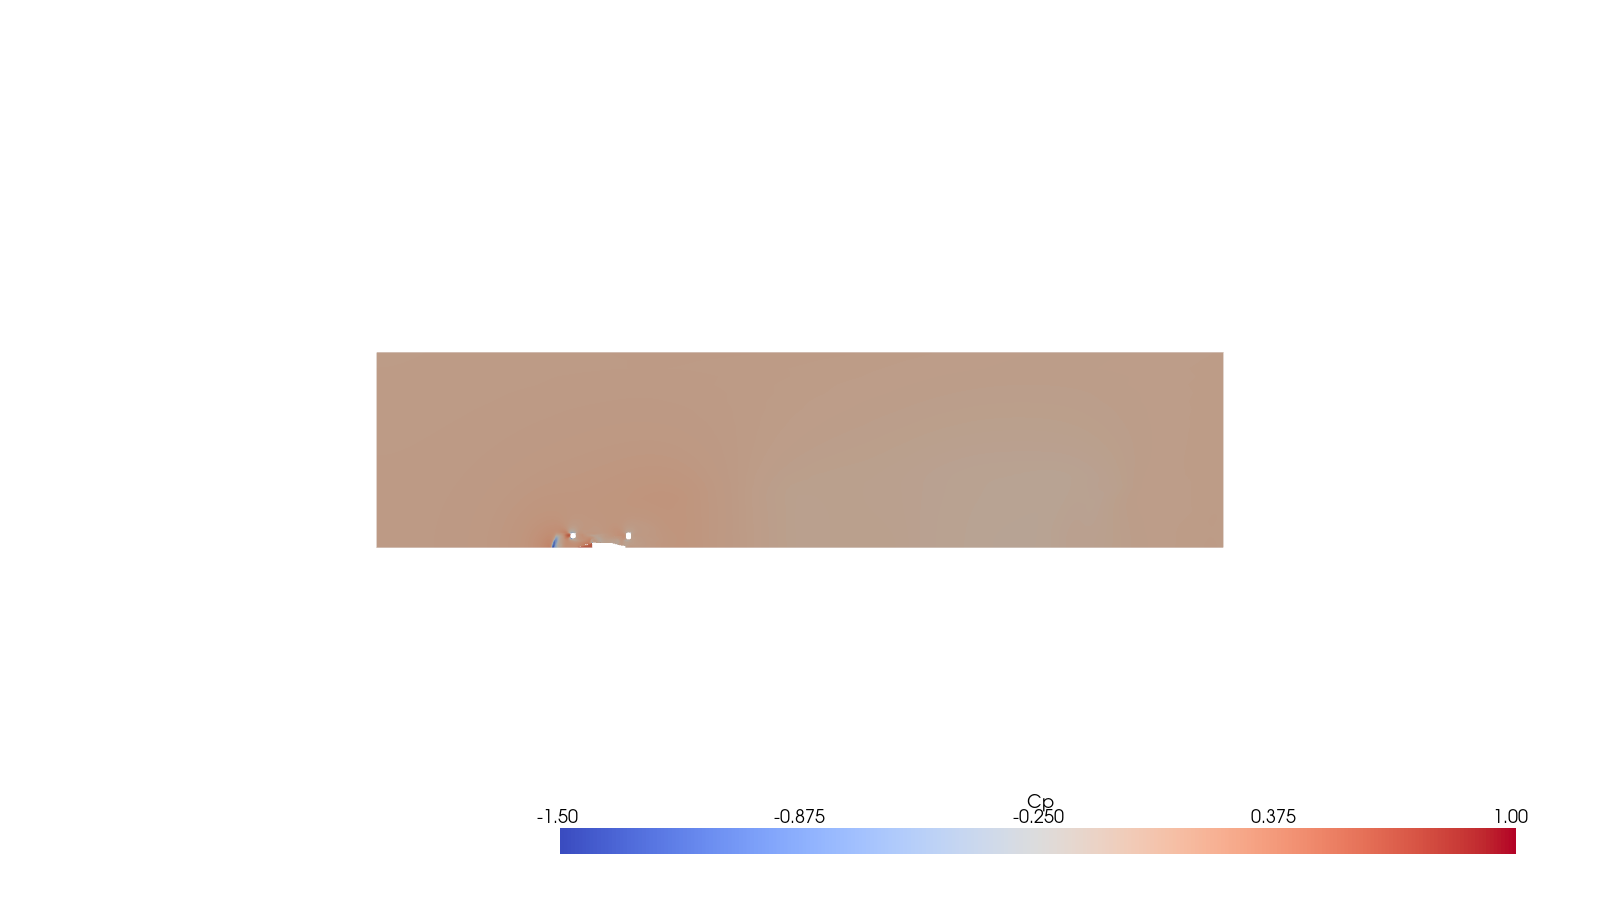
Plinths of 5 mm and 10 mm also reduced drag, but their downforce shifts remained within the 3%–5% numerical uncertainty band. At 15 mm, the trends in both drag and downforce became distinct.
I also tested step deflections by sinking the tire 2, 4, 6, and 8 mm into the ground plane. The response was non-monotonic: downforce dropped 6.1% at 6 mm sinkage, but only 2.9% at 8 mm, indicating that tire deformation interactions cannot be captured by a simple linear heuristic.
Ride Height Sensitivity
| Ride Height Lift | Underfloor | ||
|---|---|---|---|
| 0 mm | 0.2413 | −0.2498 | −0.0644 |
| +10 mm | 0.2309 | −0.2222 | −0.0571 |
| +15 mm | 0.2079 | −0.1636 | −0.0208 |
| +20 mm | Steady RANS diverged (2x) | — | — |
Raising ride height by the first 10 mm decreased total downforce by 11%. Adding another 5 mm (+15 mm total) triggered an additional 26% loss, with underfloor downforce collapsing by 64%. Between 10 mm and 15 mm lies a steep aerodynamic cliff where underfloor suction breaks down.
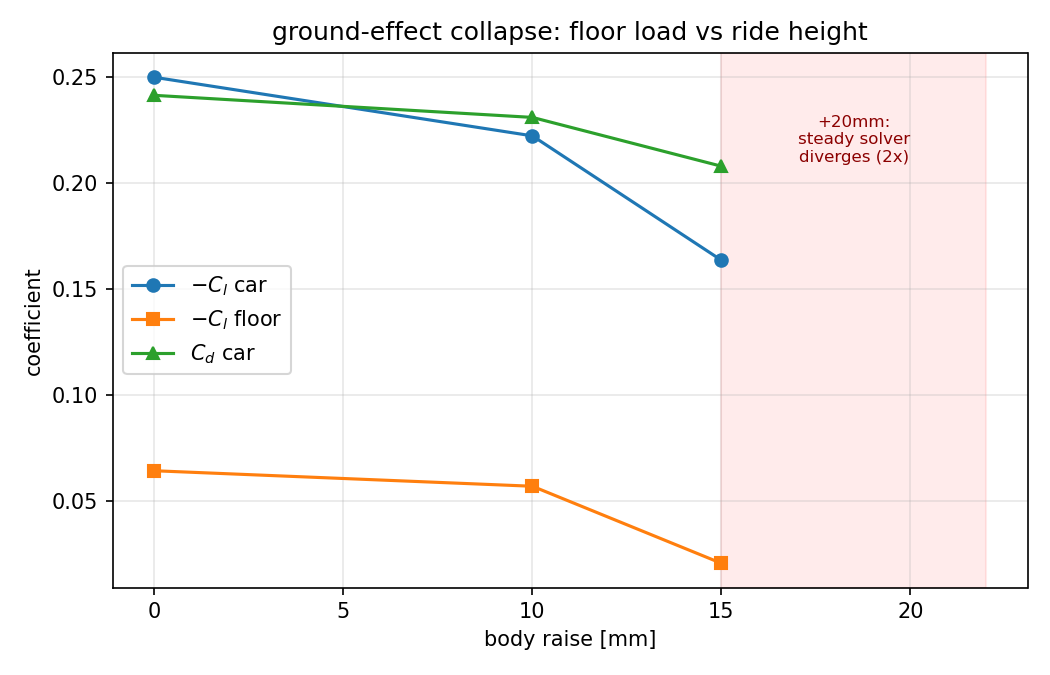
At +20 mm, steady SIMPLE simulations diverged twice, leading me to suspect physical unsteadiness. However, re-running with URANS resolved both +15 mm and +20 mm smoothly, exhibiting even smaller force oscillations than the baseline. This suggests the divergence was a numerical solver limitation under severe separation rather than genuine physical porpoising.
Yaw Sensitivity
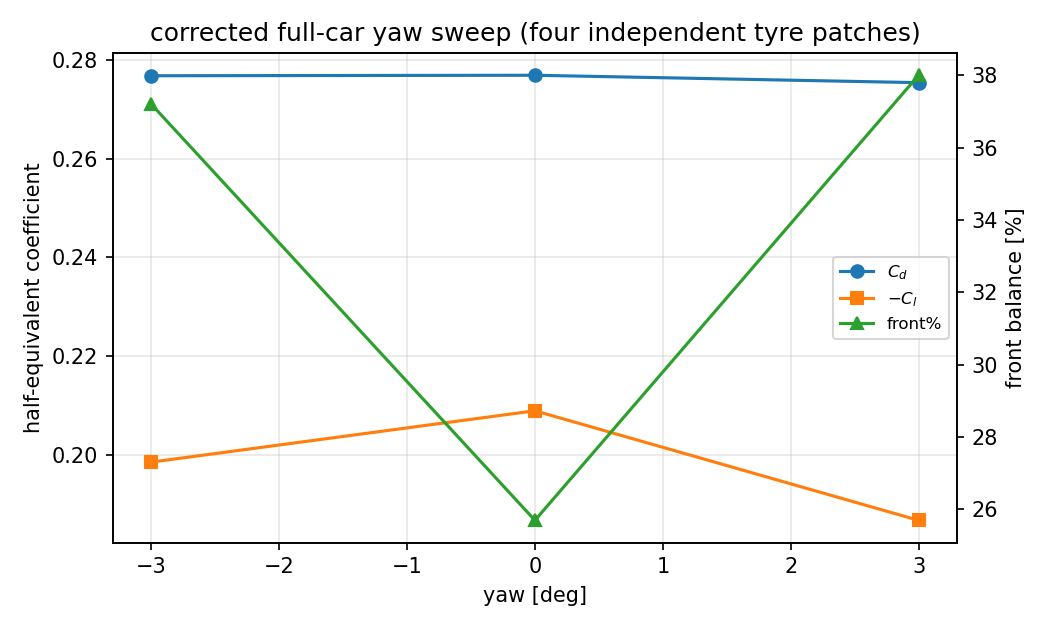
In the initial yaw cases, the left and right tires were grouped under a single rotational boundary condition with a shared rotation center. This caused an artificial 13.5% downforce asymmetry between and yaw. Recognizing this modeling error, I retracted all four early yaw cases.
In the second iteration, independent MRF / rotating wall surfaces and distinct rotation axes were assigned to each wheel. Recomputed values:
| Yaw Angle | Front Axle Distribution | ||
|---|---|---|---|
| 0.2768 | −0.1985 | 37.2% | |
| 0.2769 | −0.2089 | 25.7% | |
| 0.2754 | −0.1867 | 38.0% |
Averaging across symmetric yaw directions: at yaw, drag remained virtually unchanged (~−0.3%), total downforce decreased by 7.8%, and the front aero balance shifted forward by 11.9 percentage points.
Rake Sensitivity
I pitched the chassis forward and backward by around the front tire contact patch while keeping wheels pinned to the ground:
- Nose-down ( rake): Downforce decreased by 11.4%;
- Nose-up ( rake): Downforce decreased by 19.7%, and front balance shifted forward by 9.2 percentage points.
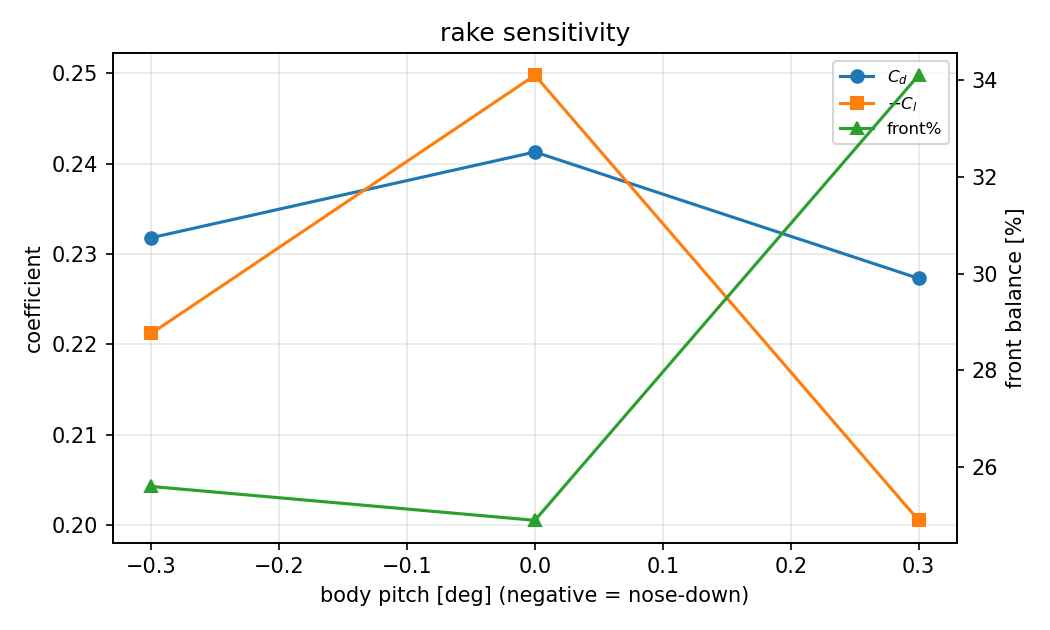
Because downforce degraded in both directions, this geometry does not obey the simplistic rule that ‘more rake equals more downforce.’ Front wing ground clearance, tire squish vortex interactions, and floor inlet ingestion combine to create a narrow, asymmetric aero attitude window.
Beyond Full-Car Integrated Forces
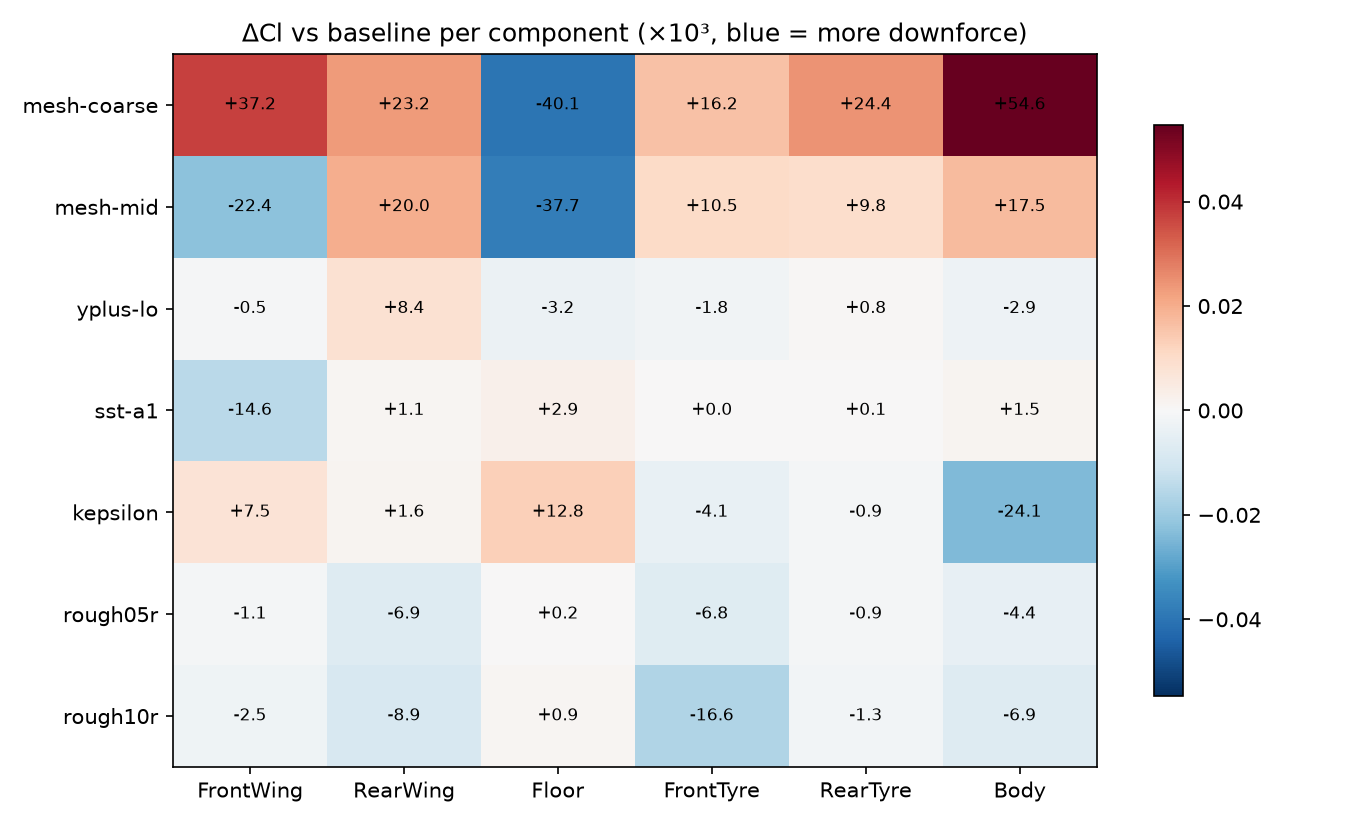
In the baseline simulation, the front wing generated a disproportionately high share of total downforce, while the underfloor contributed noticeably less than expected on modern F1 cars. This indicates that pilot-scale mesh resolution and high- wall functions did not fully resolve underbody boundary layers and suction peak development.
Another example: Realizable - and - SST turbulence models differed by only 2.8% in total vehicle , yet local surface pressure deltas were larger than those produced by maximum tire roughness. Large component-level shifts cancelled each other out in the integrated total—obscuring meaningful physical differences if one only tracks scalar totals.
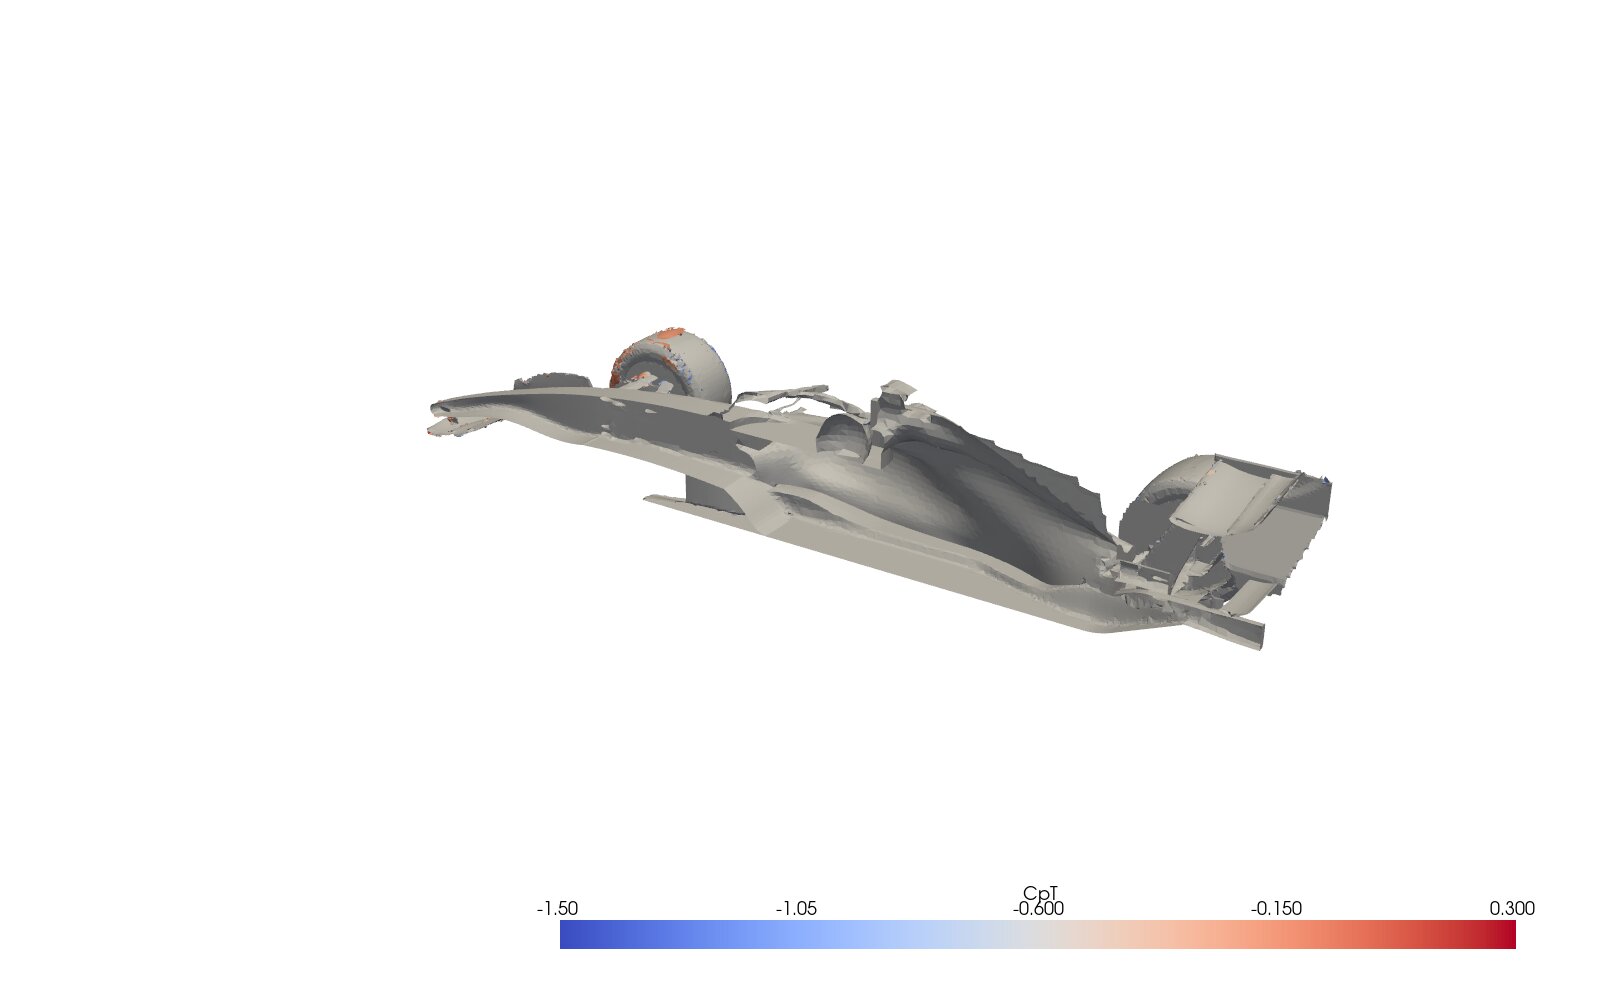
Vortex visualization presents the same caveat. Sweeping the -criterion threshold from to shrinks the isosurface representation from ~125,000 vertices down to 3,900. Any single vortex visualization is an arbitrary thresholded slice rather than an absolute ground truth.
Lap Time Trade-Offs
Because the pilot model underpredicted absolute downforce, the raw coefficients could not be fed directly into a lap time simulation. Instead, delta percentages relative to the baseline were scaled onto representative reference targets (, ).
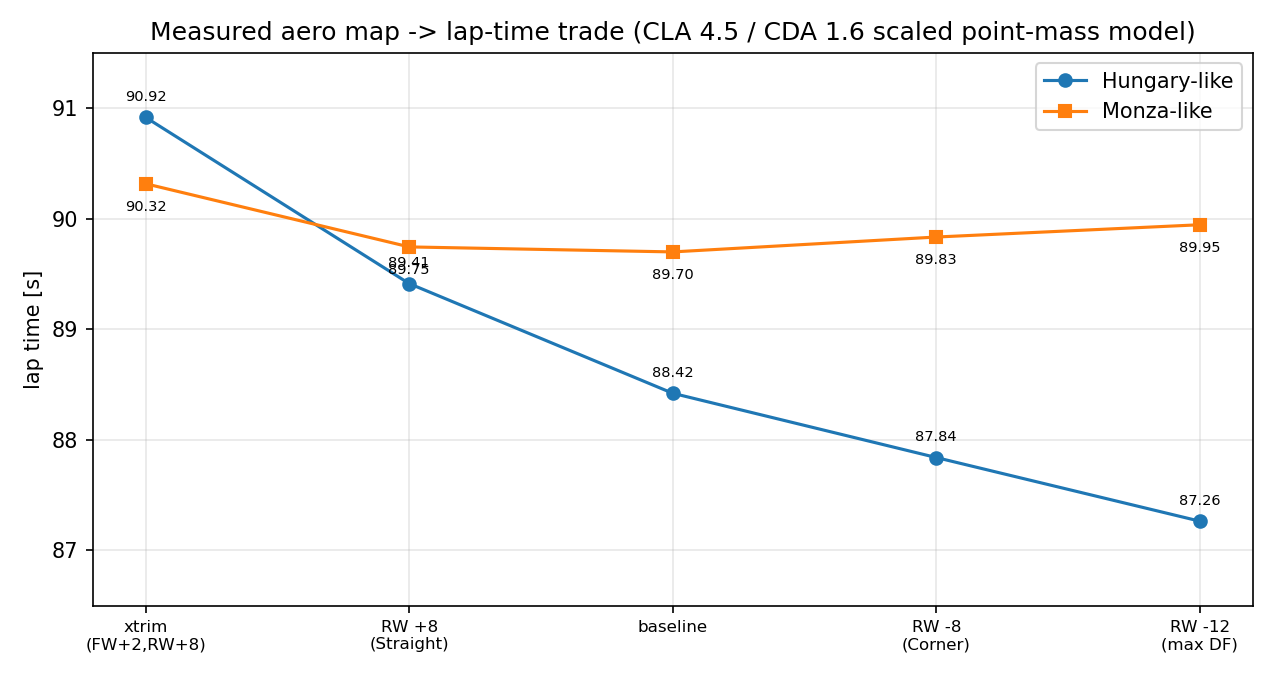
Results show that high-downforce cornering-dominated circuits favor maximum downforce trim, whereas high-speed straight-dominated circuits find their optimum at an intermediate balance rather than minimum drag trim.
Limitations of This Study
Looking closely, several notable limitations exist in this study.
The exact discrepancy between the third-party CAD model and genuine 2026 regulations remains unquantified; no wind tunnel or track telemetry is available for correlation; and formal grid convergence for downforce was not reached.
High wall functions, closed internal cooling ducts, first-order discretization, and pilot-scale mesh densities all introduce component-level load biases. Complex phenomena such as the ride height performance cliff and front wing ground-effect stall require fine-mesh resolving (), extended URANS / DES, and dynamic ride-height coupling to clarify fully—requiring higher-performance compute resources.
These findings highlight which aerodynamic mechanisms warrant further investigation and which assumptions can be ruled out. While they cannot predict exact load figures for a real car, they provide a structured baseline for future research.
Key Takeaways and Reflections
The most valuable takeaway was not any single data point, but the methodological discipline developed throughout the process. Multiple initial assumptions had to be revised:
- I assumed second-order schemes were inherently unstable on this mesh, but tuned solver relaxation settings resolved the issue;
- I hypothesized that +20 mm divergence indicated physical unsteadiness, but URANS confirmed it was a steady-state solver convergence artifact;
- I assumed the initial yaw implementation was valid, until bilateral symmetry checks revealed incorrect wheel rotation axes, prompting a full retraction.
Each of these errors initially yielded plausible numbers; they were only uncovered through control runs, uncertainty bounds, and symmetry audits.
The aerodynamic design space of Formula 1 remains vast. This pilot study lays the groundwork for a follow-up aerodynamic investigation.
To be continued.