Drive Cycle Simulation and Energy Consumption Comparison of Four Powertrain Architectures
Systematic comparison of energy consumption and CO₂ emissions across ICE, HEV, PHEV, and BEV architectures on the Spa circuit and standard driving cycles using a backward quasi-static model, quantifying PHEV initial SOC sensitivity and deadweight penalty after battery depletion.
Simulation Background and Dataset Overview
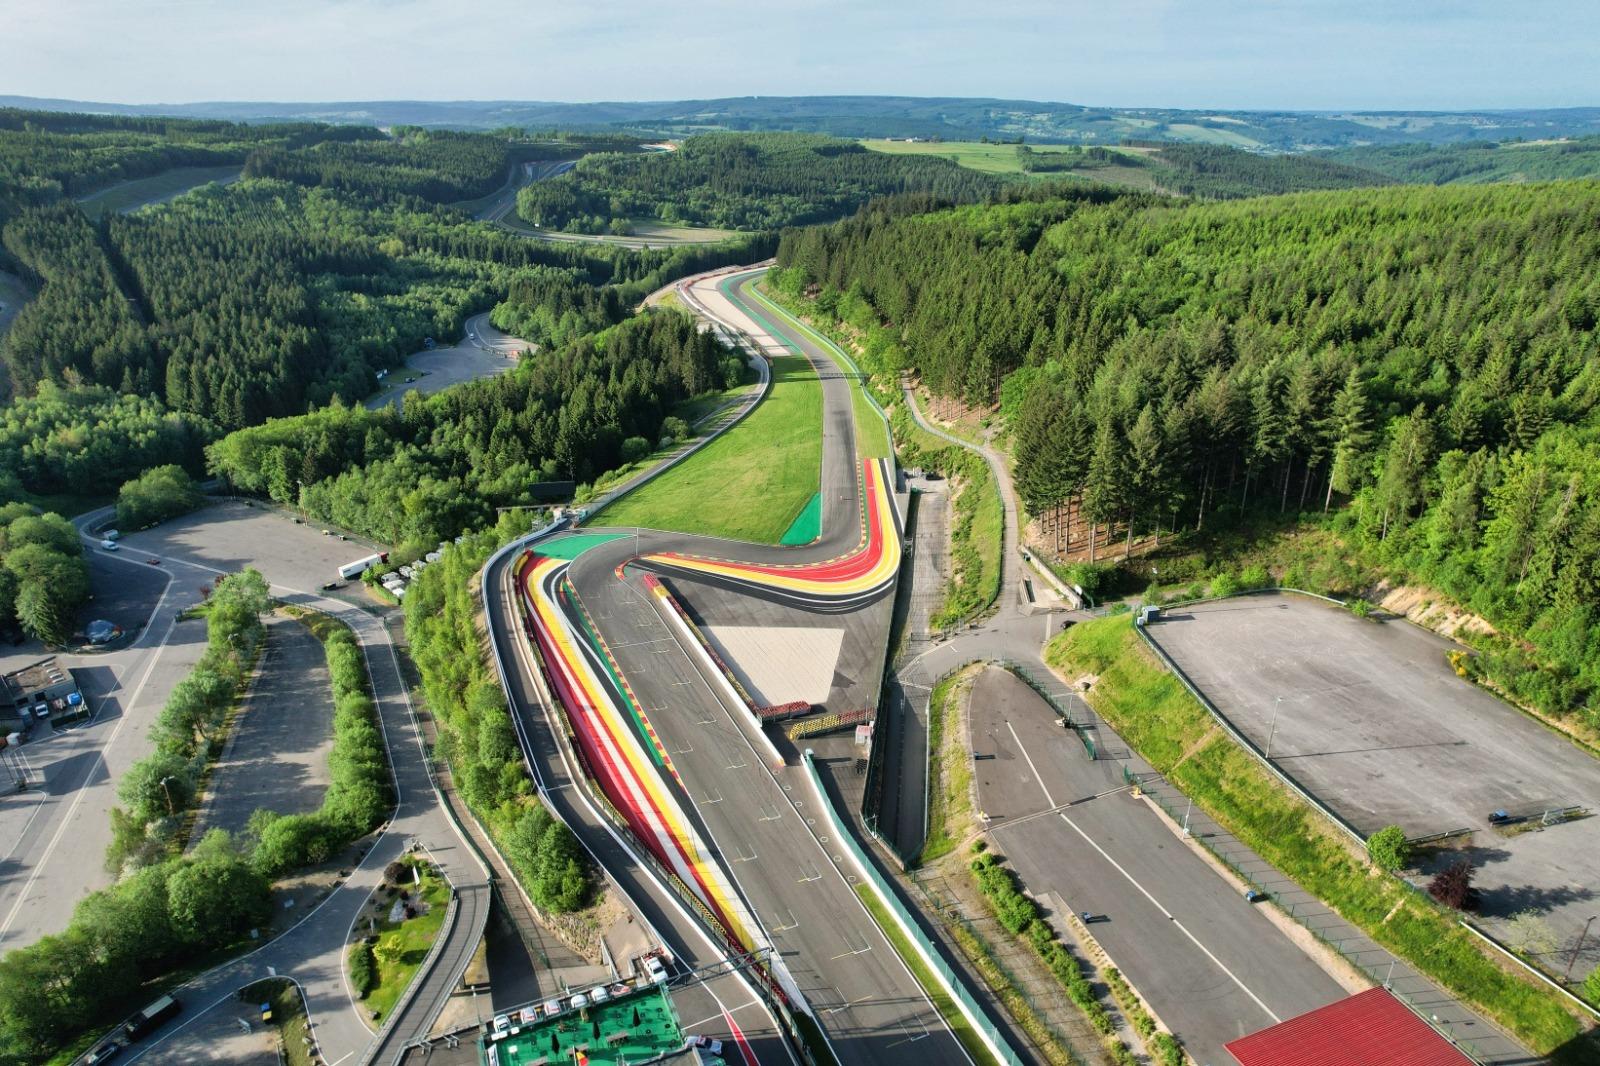
Our course instructor, who works at the Circuit de Spa-Francorchamps, provided a comprehensive dataset of powertrain specifications and drive cycles to systematically evaluate the energy consumption and emission profiles of different powertrain architectures. The dataset includes:
- Powertrain and Vehicle Parameters: Covering internal combustion engine (ICE), full hybrid (HEV), plug-in hybrid (PHEV), and battery electric (BEV) configurations. Using the Peugeot 308 as the primary baseline vehicle, detailed specifications were provided for curb weight, electric motor power, battery capacity, engine efficiency maps, and transmission gear ratios.
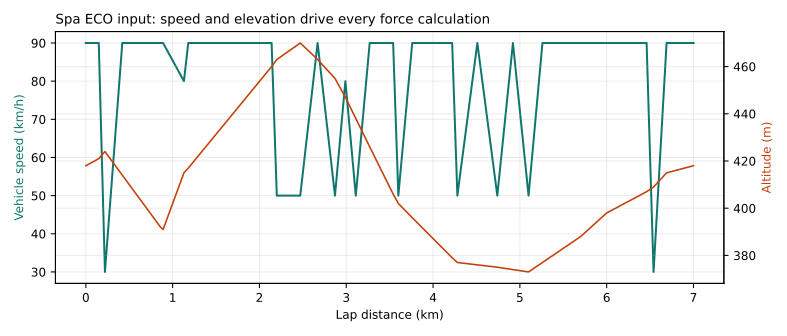
- Track Profiles and Test Cycles: Including elevation, gradient, distance, and speed profiles from the real Spa-Francorchamps circuit in Belgium, divided into a smooth ECO mode and an aggressive SPORT mode; alongside European standard test cycles (NEDC and baseline WLTC speed profiles).
- Operational Characteristics and Control Parameters: Covering 0–100 km/h acceleration/braking dynamics, engine brake specific fuel consumption (BSFC) load maps across operating points, and PHEV initial state-of-charge (SOC) configurations ranging from 0% to 100%.
Using these datasets, we established a standardized comparative framework: keeping the velocity trajectory and external road conditions identical, we reverse-calculated the required tractive power at the wheels, traced energy flows back through the engine and motor efficiency chains, and benchmarked the real-world performance of each powertrain while analyzing PHEV charge sensitivity and mass penalties.
Simulation Baseline and Physical Modeling Methodology
To ensure fair comparison, all vehicle models followed the exact same driving trajectory and velocity profile, eliminating variations caused by driving behavior or route differences. We implemented a backward quasi-static physical model: given the vehicle speed , acceleration , distance, and road slope at each time step, the total tractive force at the wheels is solved backward:
The four terms represent inertial force, rolling resistance, aerodynamic drag, and gradient resistance. The instantaneous wheel power demand is . The model then converts mechanical power into instantaneous fuel consumption or electrical draw based on driveline efficiency, engine BSFC maps, and battery/motor efficiency chains. The CO₂ emission factor for gasoline combustion is taken as 2392 g/l.
For baseline vehicle comparisons, the main input parameters for the Peugeot 308 are summarized below:
| Parameter | ICE (Gasoline) | PHEV (Plug-in Hybrid) |
|---|---|---|
| Drag Coefficient | 0.28 | 0.28 |
| Frontal Area | 2.25 m² | 2.25 m² |
| Wheel Diameter | 0.64 m | 0.64 m |
| Base Vehicle Mass | 1280 kg | 1443 kg |
| Electric Drive (Motor) Mass | — | 50 kg |
| Battery System Mass | — | 110 kg |
| Engine Maximum Power | 96 kW | 110 kW |
| Gearbox Total Ratios | 13.5 / 7.1 / 4.8 / 3.6 / 2.7 | 13.5 / 7.1 / 4.8 / 3.6 / 2.7 |
| Traction Battery Capacity | — | 12.4 kWh |
| Electric Motor Power | — | 81 kW |
| Battery / Motor Nominal Efficiency | — | 0.95 / 0.90 |
Both variants share identical aerodynamic profiles, tire specifications, and transmission ratios, isolating the effects of powertrain architecture, total curb weight, and energy management strategies.
For the Spa circuit, cornering apex speed limits were estimated from tire friction limits:
where is the friction coefficient, is gravitational acceleration, and is corner radius. The ECO mode applies moderate acceleration (0–100 km/h in 20 s), 0.4 g deceleration, and a 90 km/h speed cap. The SPORT mode unleashes full powertrain capability with braking deceleration up to ~0.6 g, with braking points determined via iterative optimization.
Data Verification and Consistency Calibration
Before conducting global comparisons, we verified the integrity of the exported simulation datasets. Early exports contained decimal truncation errors due to regional formatting differences, alongside a 2x unit discrepancy between point-integrated fuel consumption and reported totals. We applied physical conservation constraints to filter out anomalies:
- Fuel consumption and tailpipe CO₂ must strictly satisfy the 2392 g/l stoichiometric ratio;
- Distance-specific energy consumption must match the integrated 7.0 km lap total exactly;
- Instantaneous tractive force and wheel-integrated mechanical energy must remain physically continuous and closed.
Comprehensive Energy Comparison of Four Powertrain Architectures
Under the unified baseline, simulation results for the four powertrain architectures across three representative driving cycles are summarized below:
| Test Cycle | ICE (Gasoline) | HEV (Full Hybrid) | PHEV (Full Charge) | BEV (Pure Electric) |
|---|---|---|---|---|
| Spa ECO | 10.27 l / 245.7 g | 9.05 l / 216.5 g | 1.43 l / 34.2 g | 21.00 kWh / 96.7 g |
| Spa SPORT | 15.60 l / 373.1 g | 15.19 l / 363.3 g | 8.19 l / 196.0 g | 32.68 kWh / 148.4 g |
| NEDC | 6.62 l / 158.3 g | 6.46 l / 154.5 g | 0.79 l / 18.9 g | 15.30 kWh / 67.3 g |
Note: Fuel consumption is in l/100km, electricity consumption in kWh/100km, and CO₂ in g/km. Carbon emissions for ICE, HEV, and PHEV reflect direct tailpipe emissions from fuel combustion; BEV values reflect equivalent emissions under a specific grid carbon intensity.
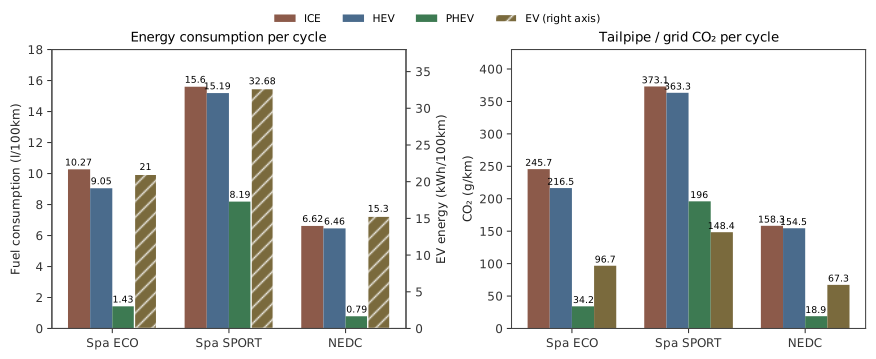
Key insights emerge from these comparative results:
- Limited Fuel Savings for HEV: In Spa SPORT, the HEV saves only 0.41 l/100km over pure ICE, and only 0.16 l/100km in NEDC. While the small buffer battery shaves peak loads and recovers deceleration energy, its limited capacity and the hybrid system’s added weight offset a substantial portion of the efficiency gains.
- High Efficiency for Fully Charged PHEV: Benefiting from electric drive efficiency and battery capacity, the fully charged PHEV reduces fuel consumption and tailpipe emissions by 86%–88% compared to ICE in Spa ECO and NEDC.
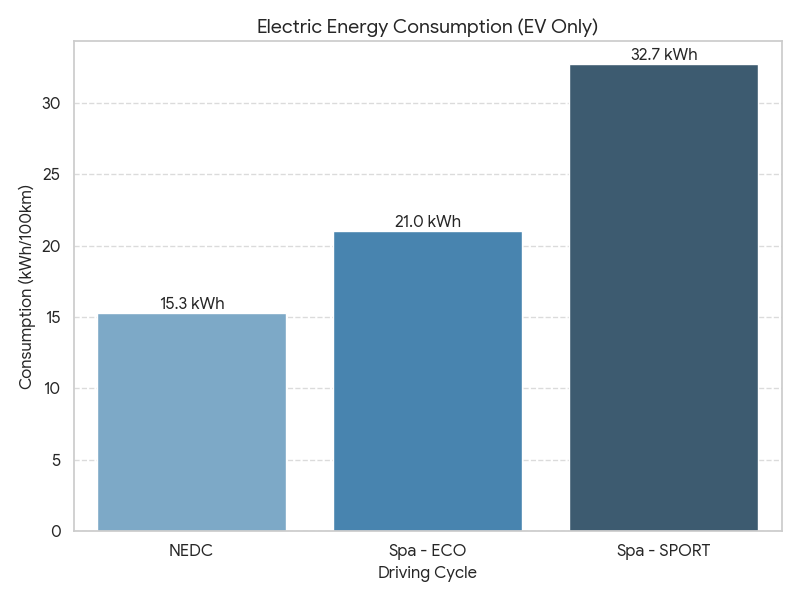
- Aggressive Driving Substantially Increases Energy Consumption Across All Architectures: In Spa SPORT, because aerodynamic drag scales quadratically with speed (power cubically), frequent hard acceleration causes ICE fuel consumption to jump to 15.60 l/100km, while BEV electricity consumption rises from 15.30 kWh/100km to 32.68 kWh/100km.
The strong performance of the fully charged PHEV raised an important question: if the vehicle departs without sufficient charge, does this advantage persist?
Nonlinear Impact of Initial State of Charge (SOC) on PHEV Efficiency
We evaluated 11 initial SOC levels in the Spa ECO cycle (from 0% to 100% in 10% increments) to quantify sensitivity to starting battery charge:
| Initial SOC | Fuel Consumption (l/100km) | Tailpipe CO₂ (g/km) |
|---|---|---|
| 0% | 11.3 | 270.7 |
| 10% | 11.3 | 270.7 |
| 20% | 9.1 | 218.7 |
| 30% | 3.7 | 88.3 |
| 40% | 1.4 | 34.2 |
| 100% | 1.4 | 34.2 |
The data reveals a distinct nonlinear step change:
- Critical Transition Zone: A pronounced inflection point exists between 20% and 40% initial SOC. Below 20%, the battery cannot sustain pure electric traction, forcing early and prolonged ICE intervention. Once initial SOC reaches 40%, the onboard energy covers virtually all high-load phases over this 7.0 km lap, rendering further increases in initial charge virtually marginal for single-lap fuel economy.
- Energy Management Logic: When starting at 0%–20% low SOC, the control strategy uses engine generation and regenerative braking to restore final SOC back into a 6%–22% buffer range; at high initial SOC, the system prioritizes battery depletion to minimize fuel use.
This directly leads to the next core question: what happens when the battery is completely depleted, turning the PHEV into an ICE vehicle burdened with deadweight from motors and batteries?
The “Deadweight Penalty” Effect After Battery Depletion
Comparing depleted versus fully charged PHEV energy consumption reveals a dramatic reversal:
| Test Cycle | PHEV (Full Charge Start) | PHEV (Depleted Battery) | Reference: ICE (Gasoline) |
|---|---|---|---|
| Spa ECO | 1.43 l / 34.2 g | 11.32 l / 270.6 g | 10.27 l / 245.7 g |
| Spa SPORT | 8.19 l / 196.0 g | 17.13 l / 409.4 g | 15.60 l / 373.1 g |
| NEDC | 0.79 l / 18.9 g | 7.20 l / 171.5 g | 6.62 l / 158.3 g |
Once the battery is depleted, PHEV fuel consumption exceeds that of the comparable pure ICE vehicle across every single driving cycle (~10% higher in Spa ECO, ~9% higher in NEDC).
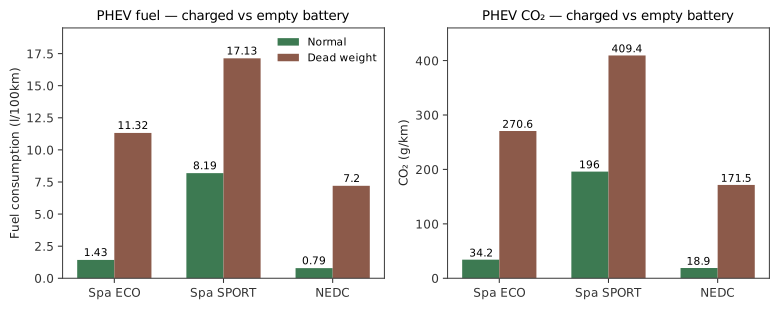
The underlying physics is straightforward:
- Deadweight Penalty: The PHEV carries an additional traction battery and electric drive system, adding approximately 300 kg over the pure gasoline version. Total wheel-end energy demand over the 7 km lap increases from 1.9 kWh (ICE) to 2.3 kWh (PHEV), an increase exceeding 20%.
- Irreversible Losses: Although regenerative braking recaptures some downhill and braking kinetic energy, rolling resistance increases linearly with mass, and the round-trip conversion chain (“kinetic energy motor battery drive”) incurs conversion losses. Without external grid charging to replenish low-cost energy, the excess mass becomes a pure penalty on the internal combustion engine.
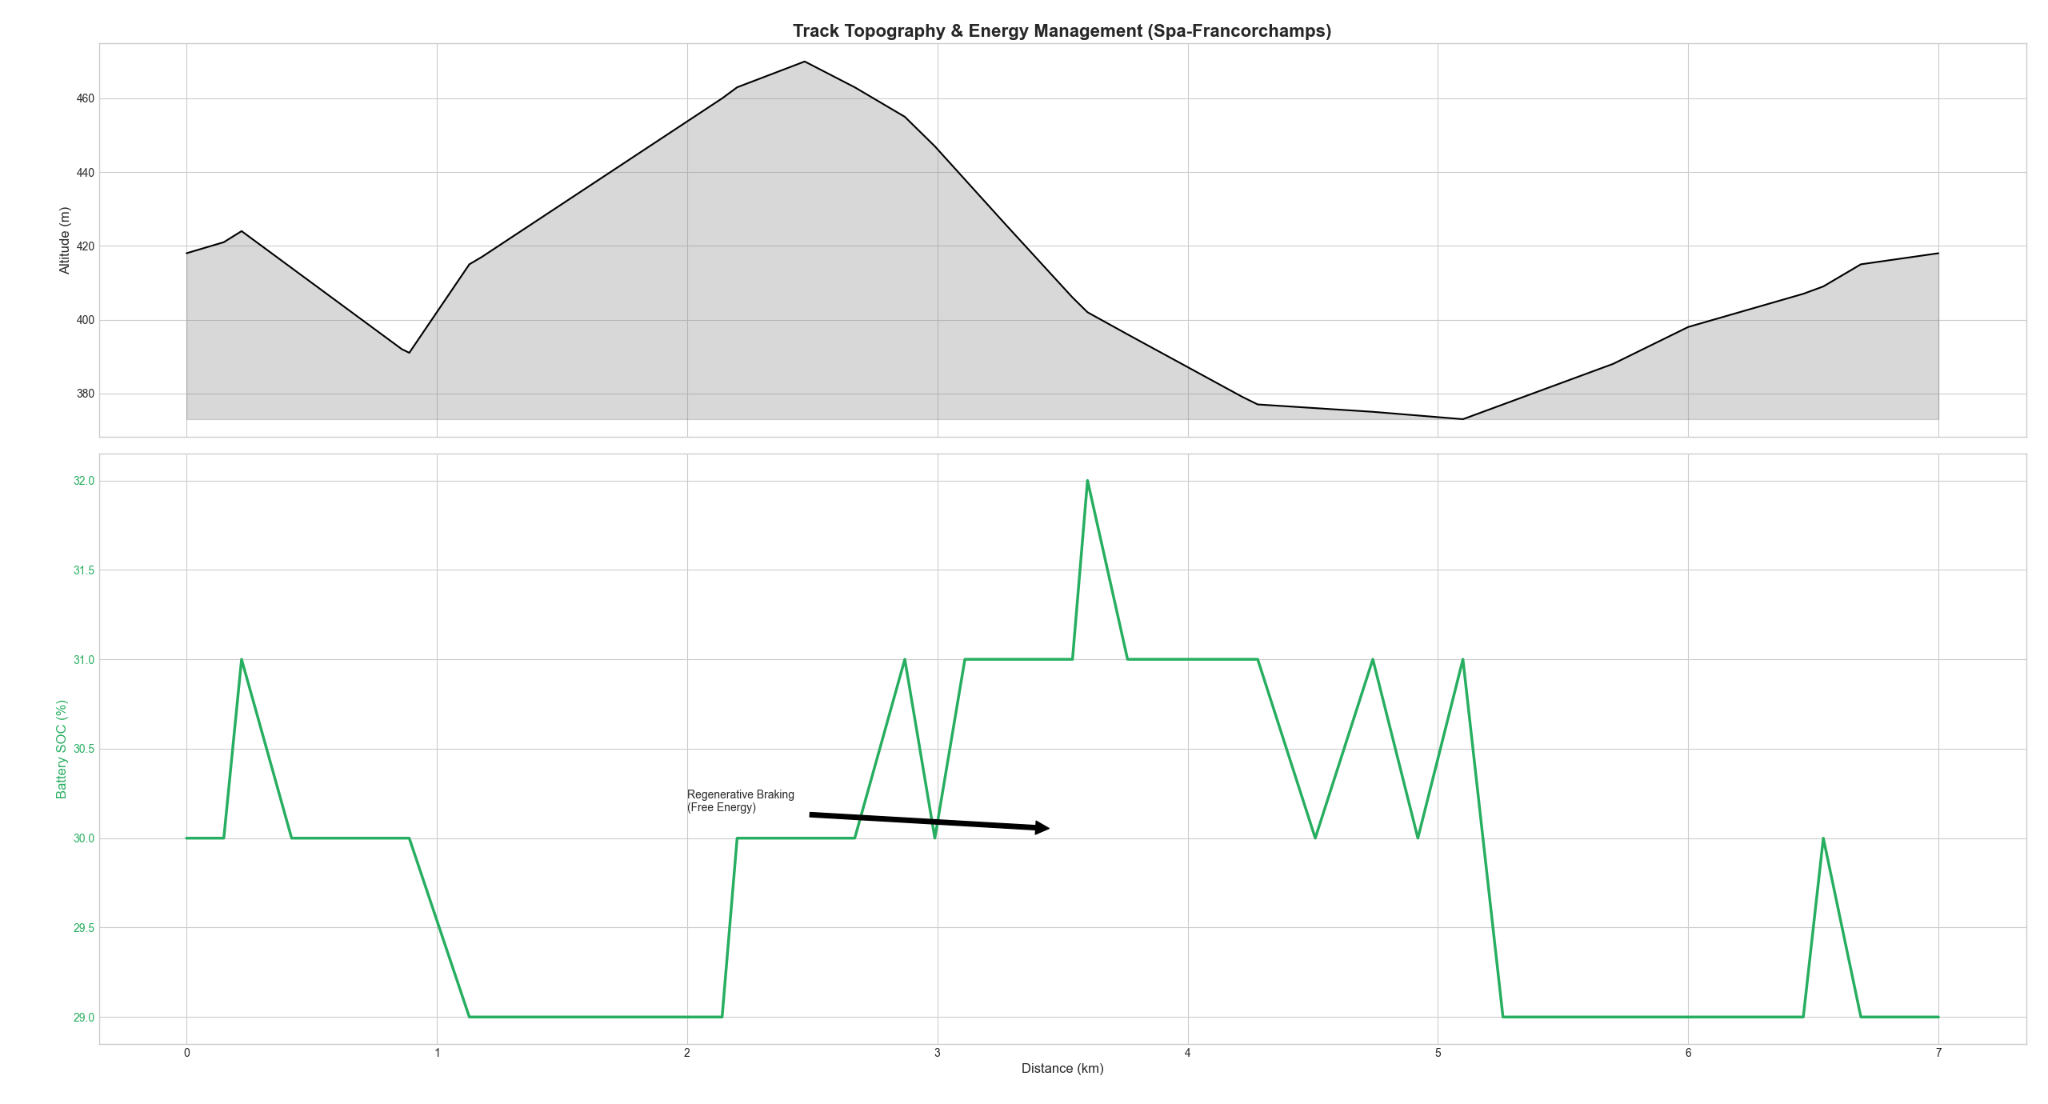
The elevation versus SOC profile shows temporary SOC recovery during downhill sections and consecutive deceleration zones, confirming active energy regeneration. However, localized recovery is insufficient to overcome the cumulative mass penalty accumulated during uphill climbs and accelerations.
Model Limitations and Engineering Boundaries
When interpreting these findings, the boundaries and assumptions of backward quasi-static modeling must be acknowledged:
- Idealized Trajectory Tracking: The model assumes perfect speed profile tracking without accounting for transmission shift shocks, clutch slip, tire slip, or driver variance.
- Omission of Auxiliary and Thermal Loads: Cabin HVAC, low-voltage electronics, temperature-dependent battery internal resistance, and engine cold-start thermal penalties are excluded.
- Simplified Regenerative Braking: Brake regeneration uses fixed efficiency and distribution rules without simulating dynamic ABS/ESP safety interventions.
- Calibration Discrepancies: Minor differences in mass definitions (curb weight vs. unladen mass) exist between early exploration and final presentation data; absolute numbers are therefore best interpreted as relative architecture trends rather than production calibration benchmarks.
European Real-World Operating Environment and Regulatory Perspectives
Placing these simulation results in the context of European passenger vehicle regulations yields broader industry insights:
- Intergenerational Shift in Test Standards: The NEDC cycle features gentle acceleration and long cruising phases, underestimating high-speed and dynamic consumption. The European Commission transitioned to WLTP to better reflect modern driving behavior, establishing fleet CO₂ targets on WLTP since 2021.
- Utility Factor Adjustments for Real PHEV Emissions: EU real-world monitoring reports indicate that due to irregular user charging habits, average on-road PHEV emissions in Europe reached 139.5 g CO₂/km in 2021—roughly 3.5 times the laboratory WLTP certified value (39.5 g/km). This closely aligns with our simulated “depleted battery mass penalty.” Consequently, Euro 6e-bis regulations revised the PHEV Utility Factor downward to enforce realistic electric driving shares.
- Spatial Heterogeneity in Grid Carbon Intensity: Lifecycle emissions for BEVs depend directly on grid cleanliness. According to European Environment Agency (EEA) data, average EU grid intensity was 183.4 g CO₂e/kWh in 2024, but with wide national variance (France at ~36 g/kWh with nuclear and hydro, compared to fossil-heavy Poland at 566 g/kWh). Evaluating BEV environmental benefits requires location- and time-specific charging context.
Key Conclusions and Future Outlook
Deconstructing these powertrain simulation datasets provides clear engineering conclusions:
- Powertrains Suit Specific Operating Contexts: BEVs offer decisive advantages in frequent stop-and-go driving under clean power grids; fully charged PHEVs provide effective low-carbon mobility for short-to-medium trips provided charging frequency is high; HEVs offer moderate fuel economy without changing fueling habits, though benefits diminish under high sustained loads.
- The Real Burden of Deadweight: In charge-depleted mode, carrying hundreds of kilograms of inactive electric powertrain components causes PHEVs to consume more fuel than equivalent conventional ICE vehicles.
- Data Consistency Verification is Essential: Engineering simulation requires strict energy balance and stoichiometric checks to prevent reporting distorted technical conclusions due to unit conversion or export artifacts.
Future extensions suggested by our instructor:
- Incorporating full WLTP phases and Real Driving Emissions (RDE) profiles across urban, rural, motorway, and mountainous terrain.
- Developing statistical charging behavior and travel chain models to simulate realistic initial SOC probability distributions.
- Simulating long-distance cross-border travel charging stops, power demands, and dynamic grid loads in line with EU Alternative Fuels Infrastructure Regulation (AFIR) requirements (fast chargers every 60 km along TEN-T corridors).
- Integrating vehicle CAN bus telemetry and On-Board Fuel Consumption Monitoring (OBFCM) data for closed-loop model calibration and validation.